

581 - S100A8/S100A9+ MACROPHAGES PROMOTE GASTRIC TUMOR PROGRESSION THROUGH THE NFκB SIGNALING PATHWAY: WEIGHTED GENE CO-EXPRESSION NETWORK AND SINGLE-CELL ANALYSIS
Methods: This single-center, retrospective study included all individuals with primary gastric cancer undergoing treatment with ICIs and with documented H. pylori status at Memorial Sloan Kettering Cancer Center between July 2013 and October 2021. Positive H. pylori status was defined as a history of prior or active infection obtained via urea breath test, stool antigen test, and/or histopathology. Negative status was defined as explicitly negative infection testing; unknowns were excluded. The primary outcomes were progression-free survival (PFS; calculated as date of ICI initiation to date of first progression or death) and overall survival (OS; calculated as date of ICI initiation until death). Secondary outcomes included PFS and OS stratified by the usage of concurrent chemotherapy and demographic or histological differences between groups. Comprehensive reviews of medical charts, endoscopic procedures, and pathology reports were performed to identify H. pylori diagnoses and confirm outcomes.
Results: Of 215 ICI-treated gastric cancer patients meeting the inclusion criteria, 49 had a documented history of H. pylori infection prior to or upon cancer diagnosis and 166 had no documented infection. Compared to H. pylori negative patients, H. pylori positive individuals were more likely to be younger, non-white, and Hispanic while also demonstrating higher rates of non-cardia gastric cancers (73.5% vs. 41.6%, p<0.01) and intestinal-type histology (81.6% vs. 65.1%, p=0.08) (Table 1). The H. pylori positive group had significantly shorter PFS and OS than the negative group with an estimated median PFS of 3.2 months vs 6.8 months (HR 1.96, p<0.01) and an estimated median OS of 9.8 months vs 17.9 months (HR 1.54, p=0.02) (Figure 1). These findings persisted when excluding patients receiving concurrent chemotherapy. Multivariable analysis confirmed H. pylori status as an independent predictor of PFS (HR 1.89, p<0.01) and OS (HR 1.80, p<0.01).
Conclusions: In the largest study to date, H. pylori infection was found to be associated with shorter PFS and OS in gastric cancer patients undergoing ICI therapy. This suggests that H. pylori status may be a predictive marker of immune responsiveness. Future studies are needed to elucidate the specific mechanisms by which this immune regulation occurs and whether treatment of active infections would benefit immunotherapy outcomes.
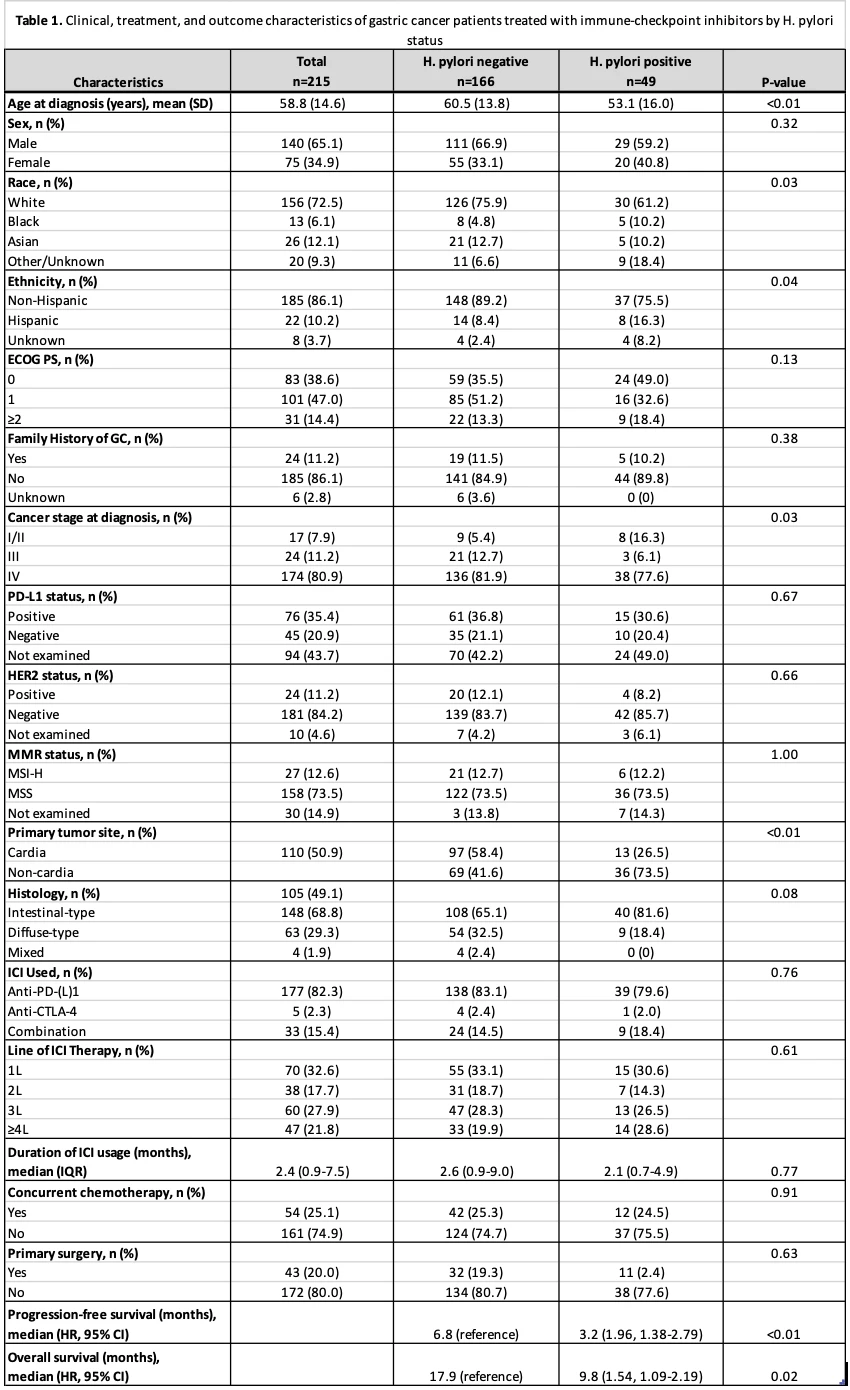
Clinical, treatment, and outcome characteristics of gastric cancer (GC) patients treated with immune-checkpoint inhibitors (ICIs) by Helicobacter pylori infection status
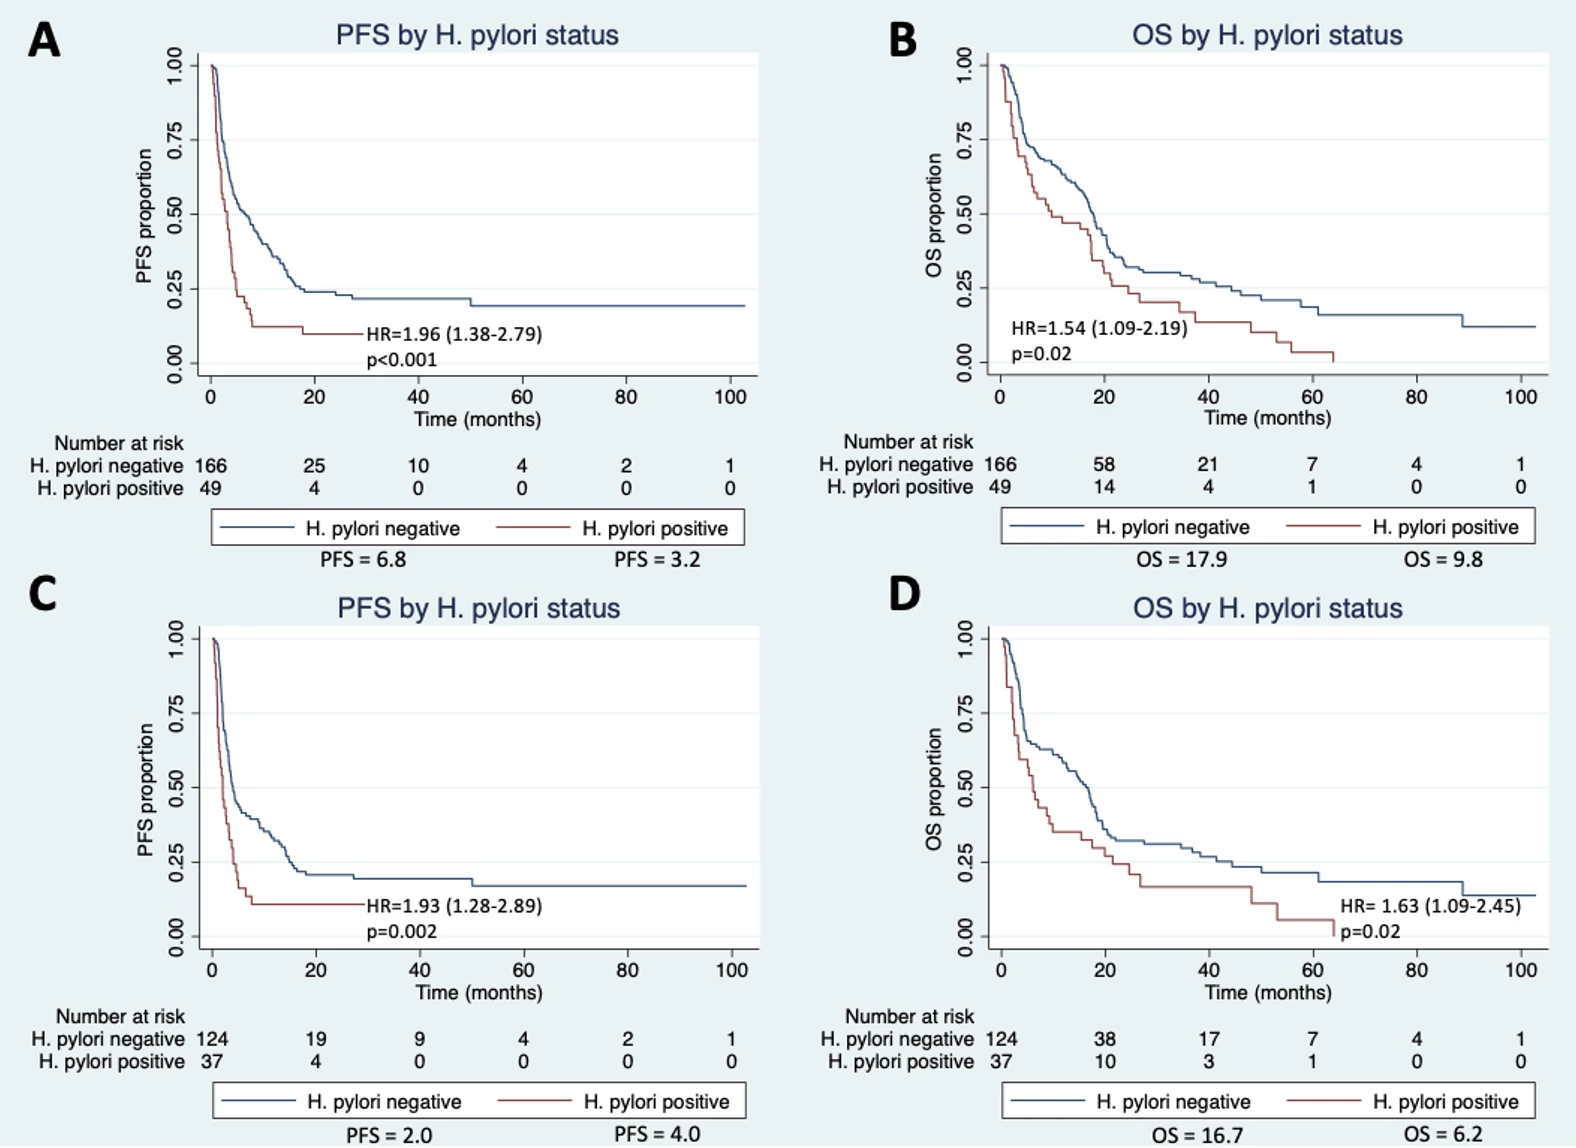
Figure 1. Survival curves of progression-free survival (PFS) and overall survival (OS) in immune checkpoint inhibitor (ICI)-treated gastric cancer patients by Helicobacter pylori infection status: A, PFS in all patients receiving ICIs and concurrent chemotherapy; B, OS in all patients receiving ICIs and concurrent chemotherapy; C, PFS in patients only receiving ICIs; D, OS in patients only receiving ICIs
Methods. We applied an algorithm of CIBERSORT to estimate the relative proportions of immune cell subsets in tissues based on the dataset (GSE55696), which was downloaded from the GEO database. Weighted gene co-expression network analysis (WGCNA) was applied to identify inflammation-related modules and hub genes. The datasets (GSE150290 and GSE134520) were used for single-cell analysis to identify pathology-related macrophage sub-clusters. Overlap genes in hub genes and macrophage sub-cluster were used for functional enrichment analysis. Gene set enrichment analysis(GSEA) analysis was carried out in mRNA-seq datasets to gain insight into the biological processes.
Results. A module (greenyellow) was found to be positively correlated with pathological changes and highly related to inflammation scores(figure 1A). The single-cell analysis identified the macrophage subpopulation and found that S100A8 and S100A9+ macrophages constituted a significantly larger proportion in EGC tissues (figure 1B-G). The functional enrichment analysis of the overlapping gene of greenyellow module and S100A8 and S100A9+ macrophages subpopulation found that S100A8 and S100A9+ macrophages might induce gastric tumorigenesis through the NFκB Signaling Pathway(figure 2A-F). GSEA analysis suggested that genes S100A8 and S100A9 could regulate the NUP98_HOXA9(FDR q-value=0.067, FWER p-value=0.047) and AML1_MTG8(FDR q-value=0.133, FWER p-value=0.047) protein fusion(figure 2G, H), which were known to affect the malignant proliferation of monocyte-macrophages.
Conclusions. The S100A8 and S100A9+ macrophages might promote gastric tumor progression through the NFκB signaling pathway. Monocyte-macrophage proliferation might play a crucial role in gastric cancer progression in gastric premalignant lesions.
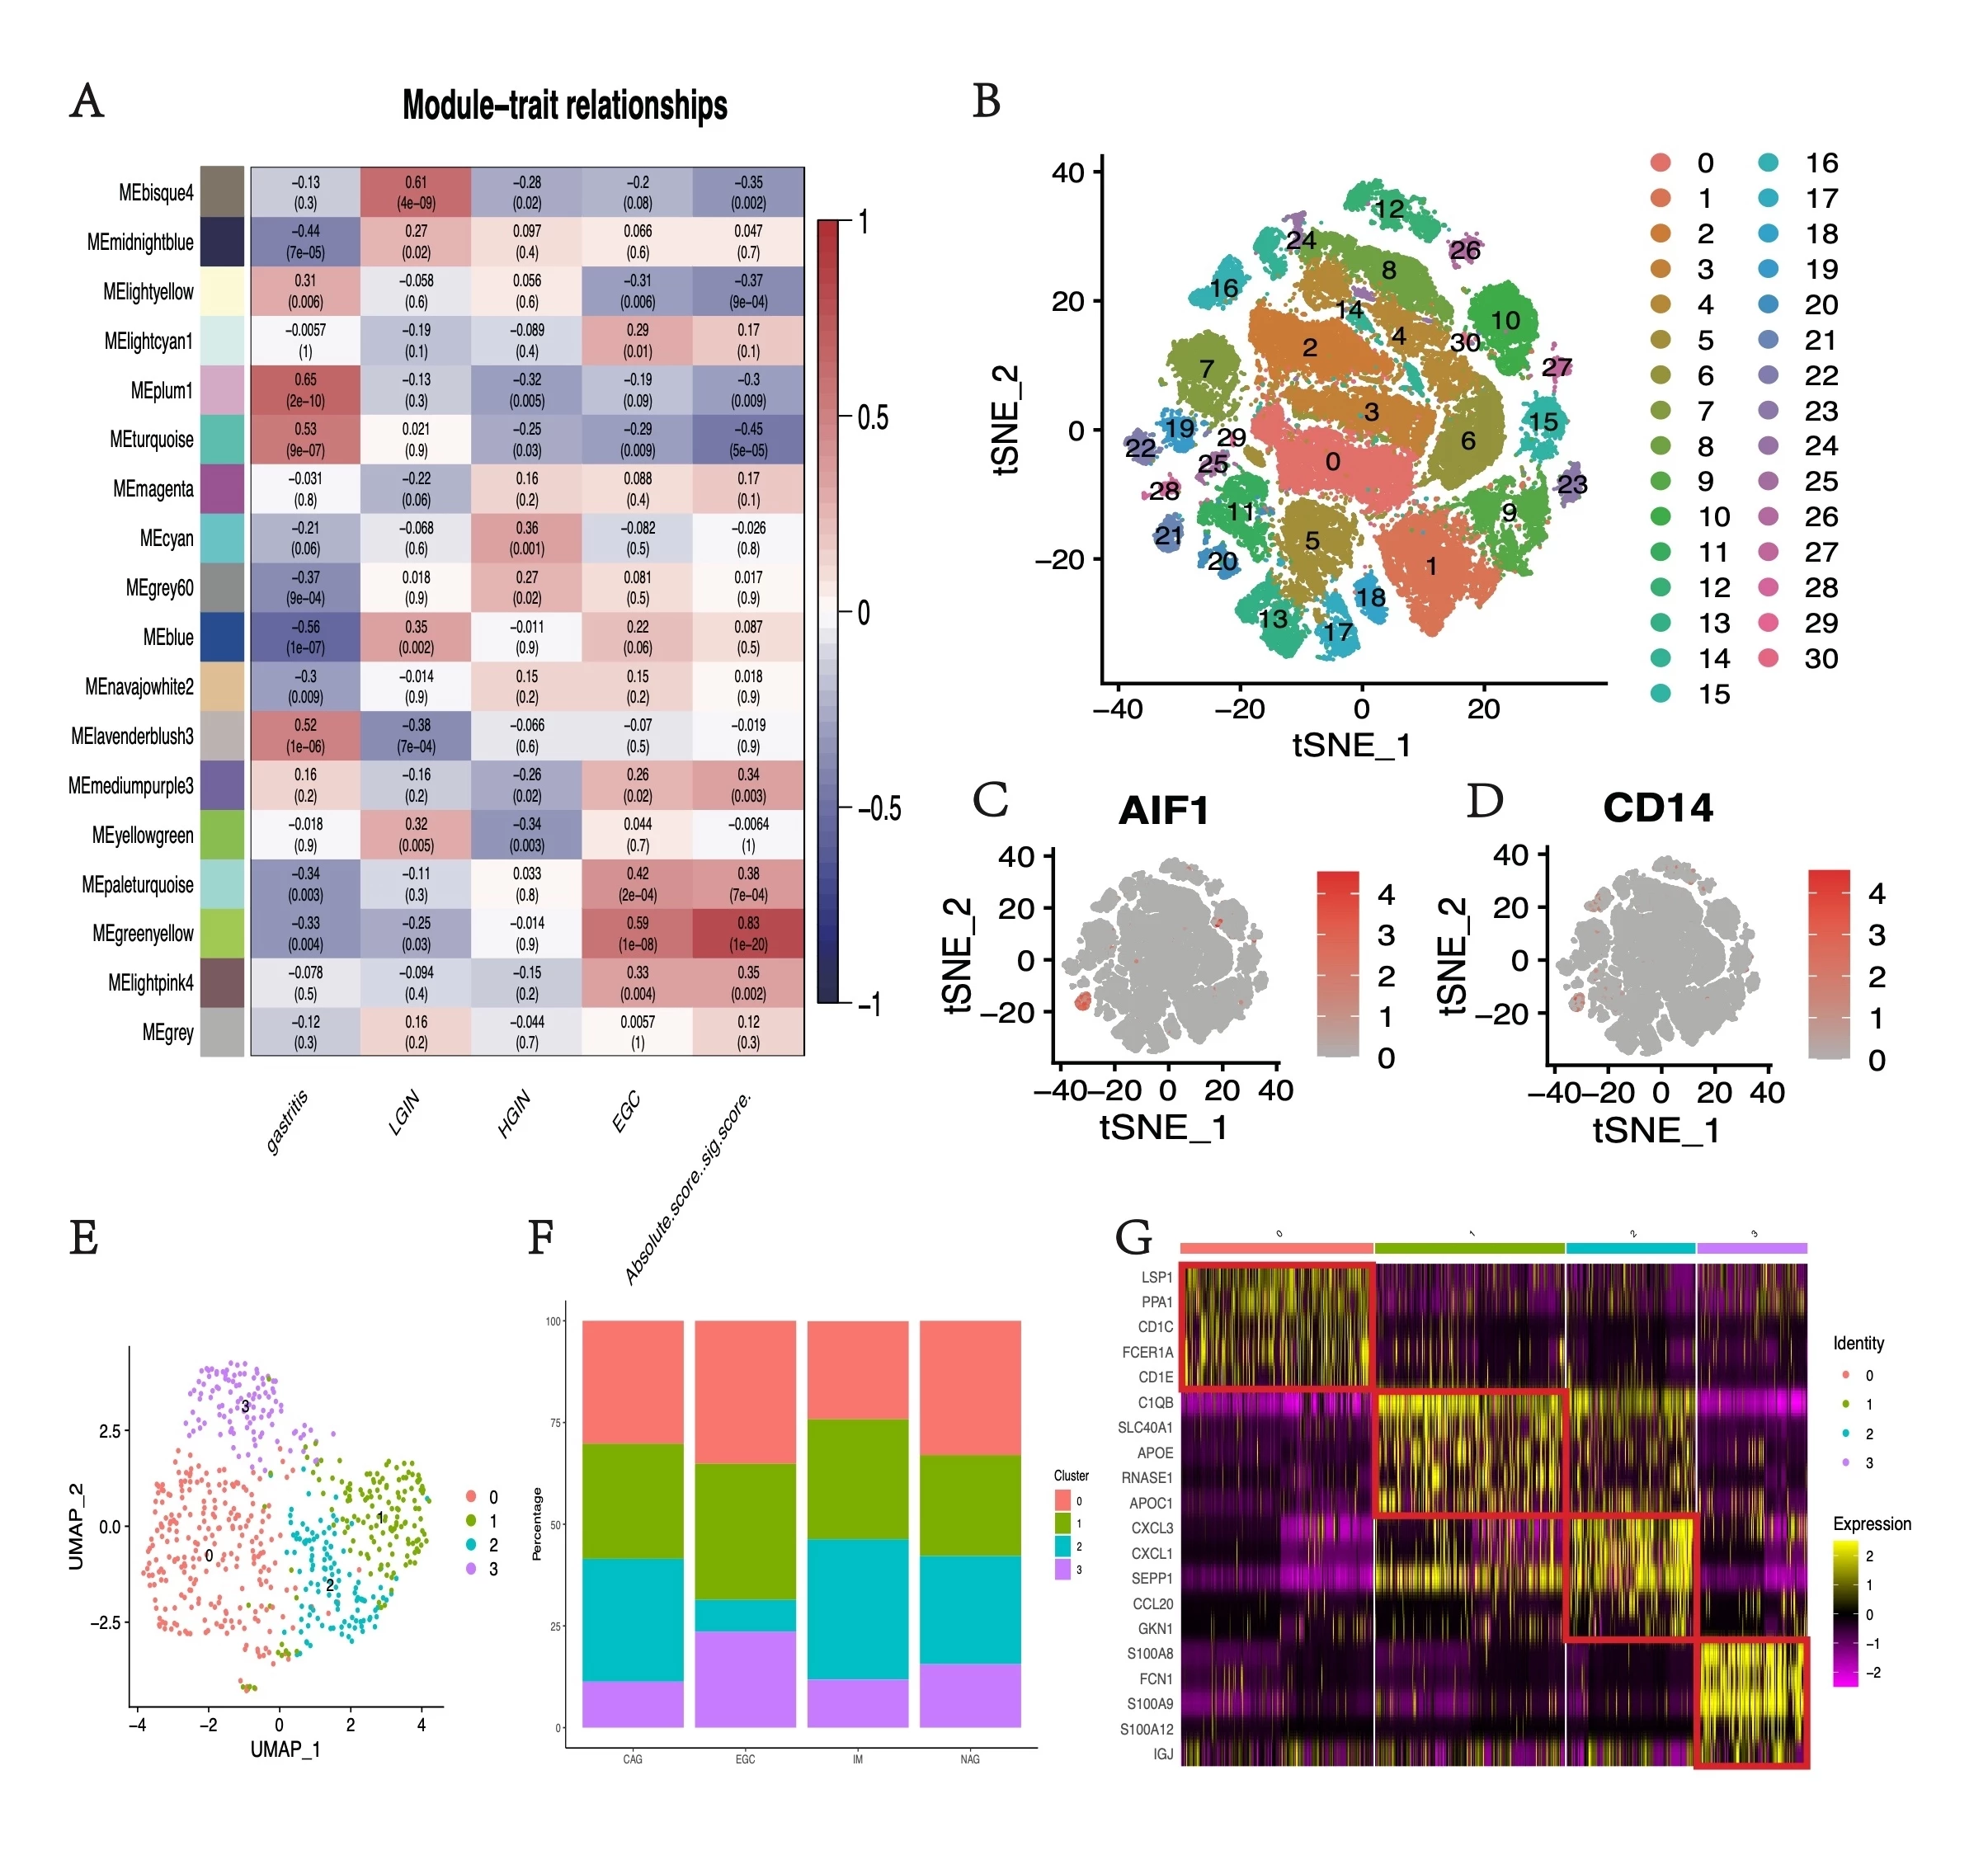
Figure 1. WGCNA and single-cell RNA analysis of the gastric premalignant lesions. (A) Module-trait relationships of gastritis, LGIN, HGIN, EGC, and the absolute score of immune cells. (B) The tSNE plot of cell clusters. (C)& (D) AIF1 and CD14 expression distribution map. (E) The tSNE plot of macrophage cell clusters. (F) Percentages of cell clusters identified by pathology classification. (G) The relative expression heat map for macrophage cell cluster markers. Only the top five are shown.
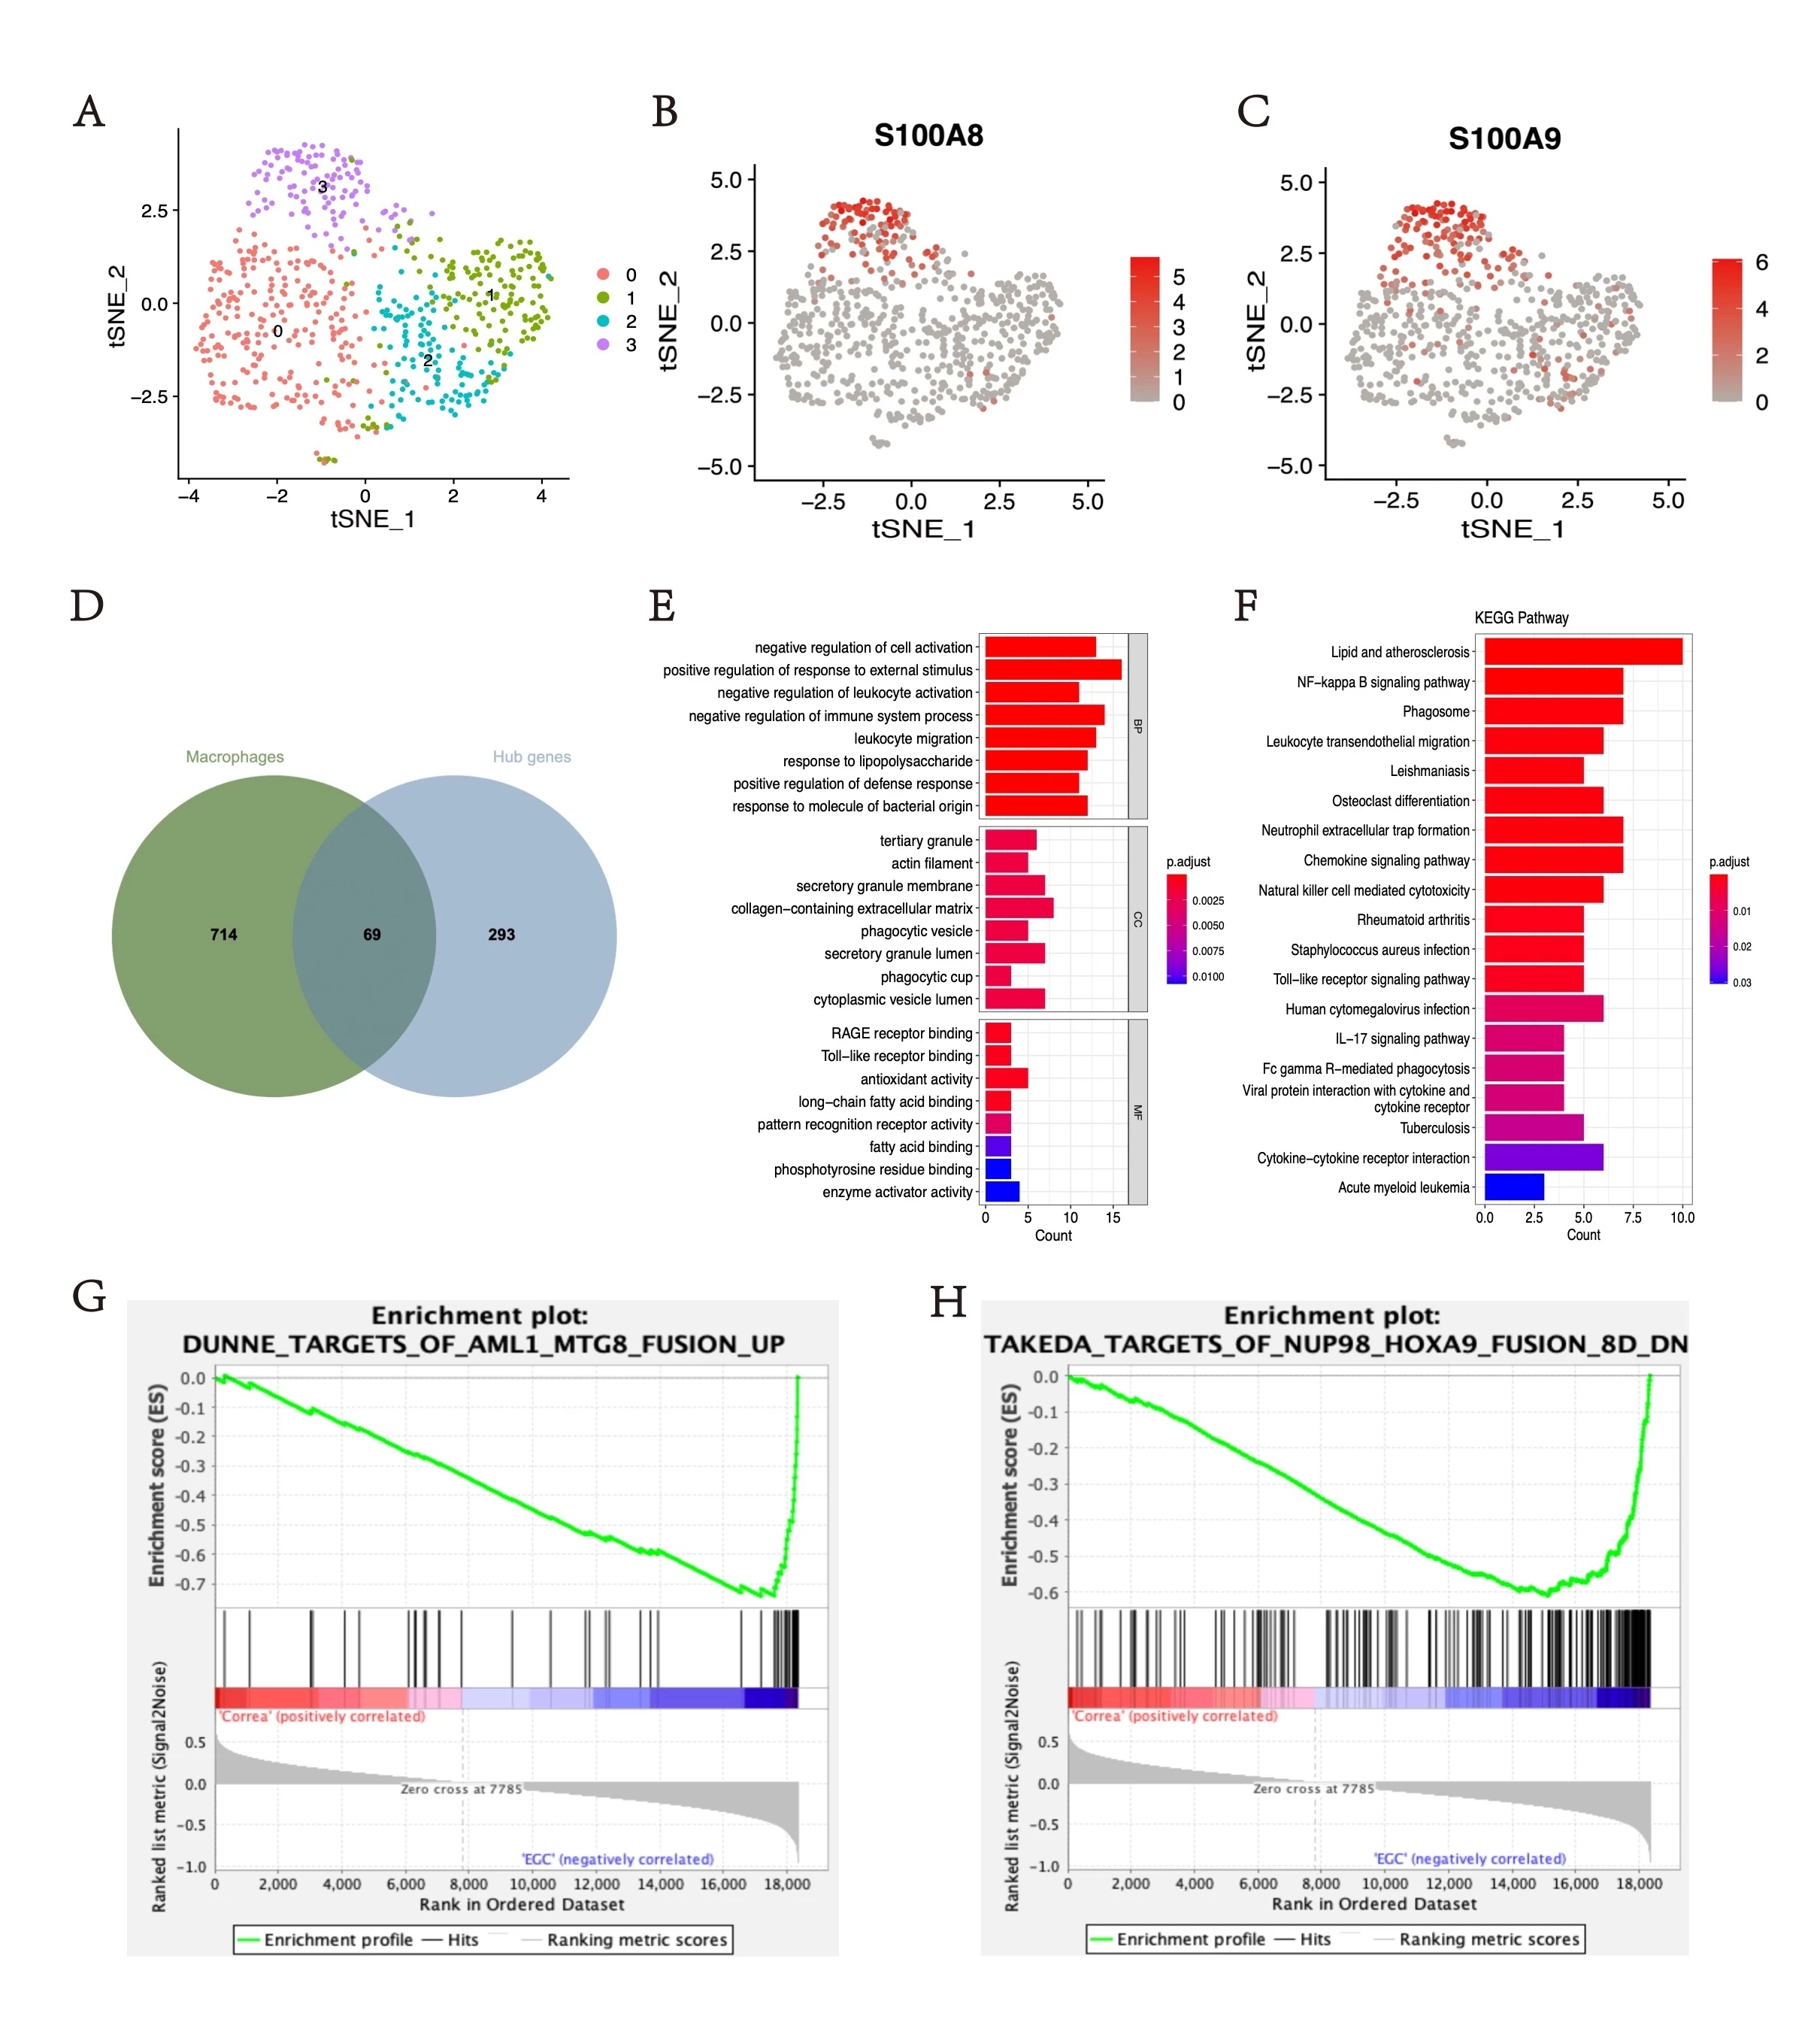
Figure 2. (A) The tSNE plot of macrophage cell clusters. (B) & (C) S100A8 and S100A9 expression distribution map. (D) Venn plot of overlapped genes in the greenyellow module and S100A8 and subpopulation of S100A9+ macrophage. (E) GO analysis in overlapping genes. (F) KEGG pathways analysis in overlapping genes. (G) & (H) GSEA analysis of all genes in the greenyellow module.

